Locus 88
Top associations per target
| Target | cis/trans | Study | SNP | SNP location | Maj/min allele | MAF | N | βinv | seinv | Pinv | fclog | Plog | Praw |
|---|---|---|---|---|---|---|---|---|---|---|---|---|---|
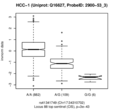
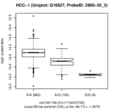
| HCC-1 | cis | Discovery | rs41341749 | 17:34,310,702 | A/G | 0.06 | 997 | -1.171 | 0.081 | 3×10-43 | -1.360 | 5×10-48 | 8.3×10⁻³⁴ |
| HCC-1 | cis | Replication | rs41341749 | 17:34,310,702 | A/G | 0.07 | 337 | -0.795 | 0.117 | 4.9×10⁻¹¹ | -1.370 | 4.5×10⁻¹⁰ | 7.8×10⁻⁶ |
| MPIF-1 | cis | Discovery | rs41341749 | 17:34,310,702 | A/G | 0.06 | 997 | 1.032 | 0.084 | 3.1×10⁻³² | 1.360 | 3.3×10⁻³⁵ | 9.6×10-40 |
| MPIF-1 | cis | Replication | rs9892586 | 17:34,313,915 | A/G | 0.07 | 337 | 0.934 | 0.128 | 2.4×10⁻¹² | 1.340 | 1.6×10⁻¹² | 1.9×10⁻¹² |
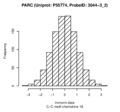
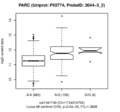
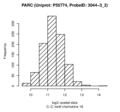
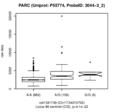
| PARC | cis | Discovery | rs41341749 | 17:34,310,702 | A/G | 0.06 | 997 | 0.755 | 0.083 | 6.3×10⁻¹⁹ | 1.390 | 2.6×10⁻²⁰ | 4.1×10⁻²² |
| PARC | cis | Replication | rs41341749 | 17:34,310,702 | A/G | 0.07 | 337 | 0.212 | 0.144 | 0.142 | 1.080 | 0.173 | 0.25 |
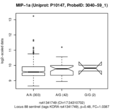
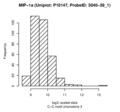
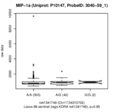
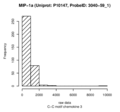
| MIP-1a | cis | Discovery | rs41341749 | 17:34,310,702 | A/G | 0.06 | 997 | 0.544 | 0.088 | 1×10⁻⁹ | 1.100 | 2×10⁻⁴ | 0.981 |
| MIP-1a | cis | Replication | rs41341749 | 17:34,310,702 | A/G | 0.07 | 337 | 0.146 | 0.142 | 0.304 | 1.040 | 0.468 | 0.964 |
Regional association plots
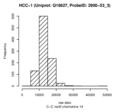
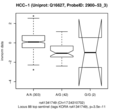
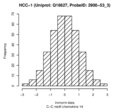
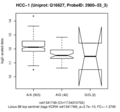
C-C motif chemokine 14 (HCC-1)
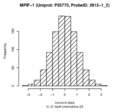
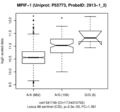
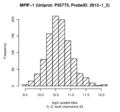
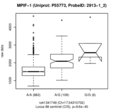
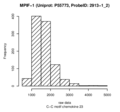
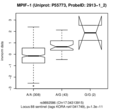
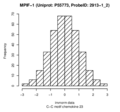
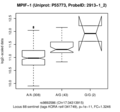
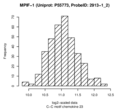
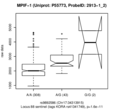
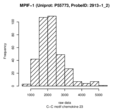
C-C motif chemokine 23 (MPIF-1)
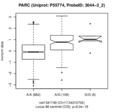
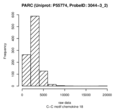
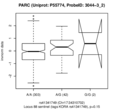
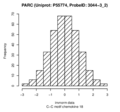
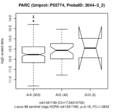
C-C motif chemokine 18 (PARC)
C-C motif chemokine 3 (MIP-1a)
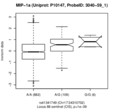
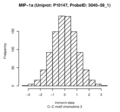
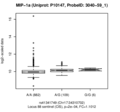
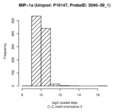
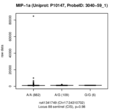
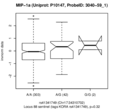
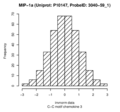
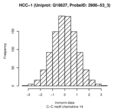
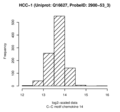
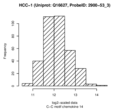
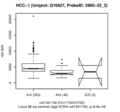
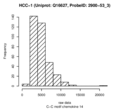
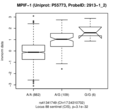
Boxplots and histograms for top associations
C-C motif chemokine 14 (HCC-1)
| inverse-normalized probe levels | log2 transformed probe levels | raw probe levels | |
|---|---|---|---|
| Discovery study |
|
|

|
| Replication study |
|
|
|
C-C motif chemokine 23 (MPIF-1)
| inverse-normalized probe levels | log2 transformed probe levels | raw probe levels | |
|---|---|---|---|
| Discovery study |
|
|
|
| Replication study |
|
|
|
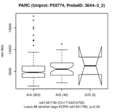
C-C motif chemokine 18 (PARC)
| inverse-normalized probe levels | log2 transformed probe levels | raw probe levels | |
|---|---|---|---|
| Discovery study |
|
|
|
| Replication study |
|
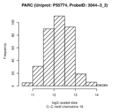
|
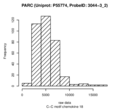
|
C-C motif chemokine 3 (MIP-1a)
C-C motif chemokine 14 (HCC-1)
| Target (abbrv.) | HCC-1 |
| Target (full name) | C-C motif chemokine 14 |
| Somalogic ID (Sequence ID) | SL003329 (2900-53_3) |
| Entrez Gene Symbol | CCL14 |
| UniProt ID | Q16627 |
| UniProt Comment |
|
| Pathway Studio |
|
C-C motif chemokine 23 (MPIF-1)
| Target (abbrv.) | MPIF-1 |
| Target (full name) | C-C motif chemokine 23 |
| Somalogic ID (Sequence ID) | SL003302 (2913-1_2) |
| Entrez Gene Symbol | CCL23 |
| UniProt ID | P55773 |
| UniProt Comment |
|
| Reactome |
|
| Pathway Studio |
|
C-C motif chemokine 18 (PARC)
| Target (abbrv.) | PARC |
| Target (full name) | C-C motif chemokine 18 |
| Somalogic ID (Sequence ID) | SL003323 (3044-3_2) |
| Entrez Gene Symbol | CCL18 |
| UniProt ID | P55774 |
| UniProt Comment |
|
| Biomarker applications (based on IPA annotation) |
|
C-C motif chemokine 3 (MIP-1a)
| Target (abbrv.) | MIP-1a |
| Target (full name) | C-C motif chemokine 3 |
| Somalogic ID (Sequence ID) | SL000519 (3040-59_1) |
| Entrez Gene Symbol | CCL3 |
| UniProt ID | P10147 |
| UniProt Comment |
|
| Biomarker applications (based on IPA annotation) |
|
| Wiki Pathways |
|
| Pathway Interaction Database |
|
| Reactome |
|
| Pathway Studio |
|
All locus annotations are based on the sentinel SNP (rs41341749) and 4 proxy variant(s) that is/are in linkage disequilibrium r2 ≥ 0.8. Linkage disequilibrium is based on data from the 1000 Genomes Project, phase 3 version 5, European population and was retrieved using SNiPA's Block Annotation feature.
Download the detailed results of SNiPA's block annotation (PDF)
Linked genes
| Genes hit or close-by |
|
| Potentially regulated genes |
Results from other genome-wide association studies
| Trait | P | Study | Source |
|---|---|---|---|
| Adiponectin levels | 2.3×10⁻⁴ | 22479202 (PMID) | GRASP2 nonQTL |
Increased CCL14 may induce decrease in CCL23 protein levels.
This locus includes two replicated cis-associations, with C-C motif chemokine 14 (CCL14, aka HCC1) and C-C motif chemokine 23 (CCL23, aka MPIF-1). Two further associations with CCL18 and CCL3 did not have sufficient replication power and were not replicated – note that Locus 87 harbours replicated cis-QTLs for these two chemokines. The association of rs41341749 with CCL14 and CCL23 has opposite direction, and the strength of association for the ratio of both increases by 35 orders of magnitude (p-gain=2.3×1035 in KORA, replicated 7.5×10¹² in QMDiab). Note that there are multiple C-C motif chemokines encoded at this locus, including CCL3/4/5/7/14/15/16/18/23. SNiPA annotation identifies several variants that are tagged by rs41341749 and that regulate CCL14. 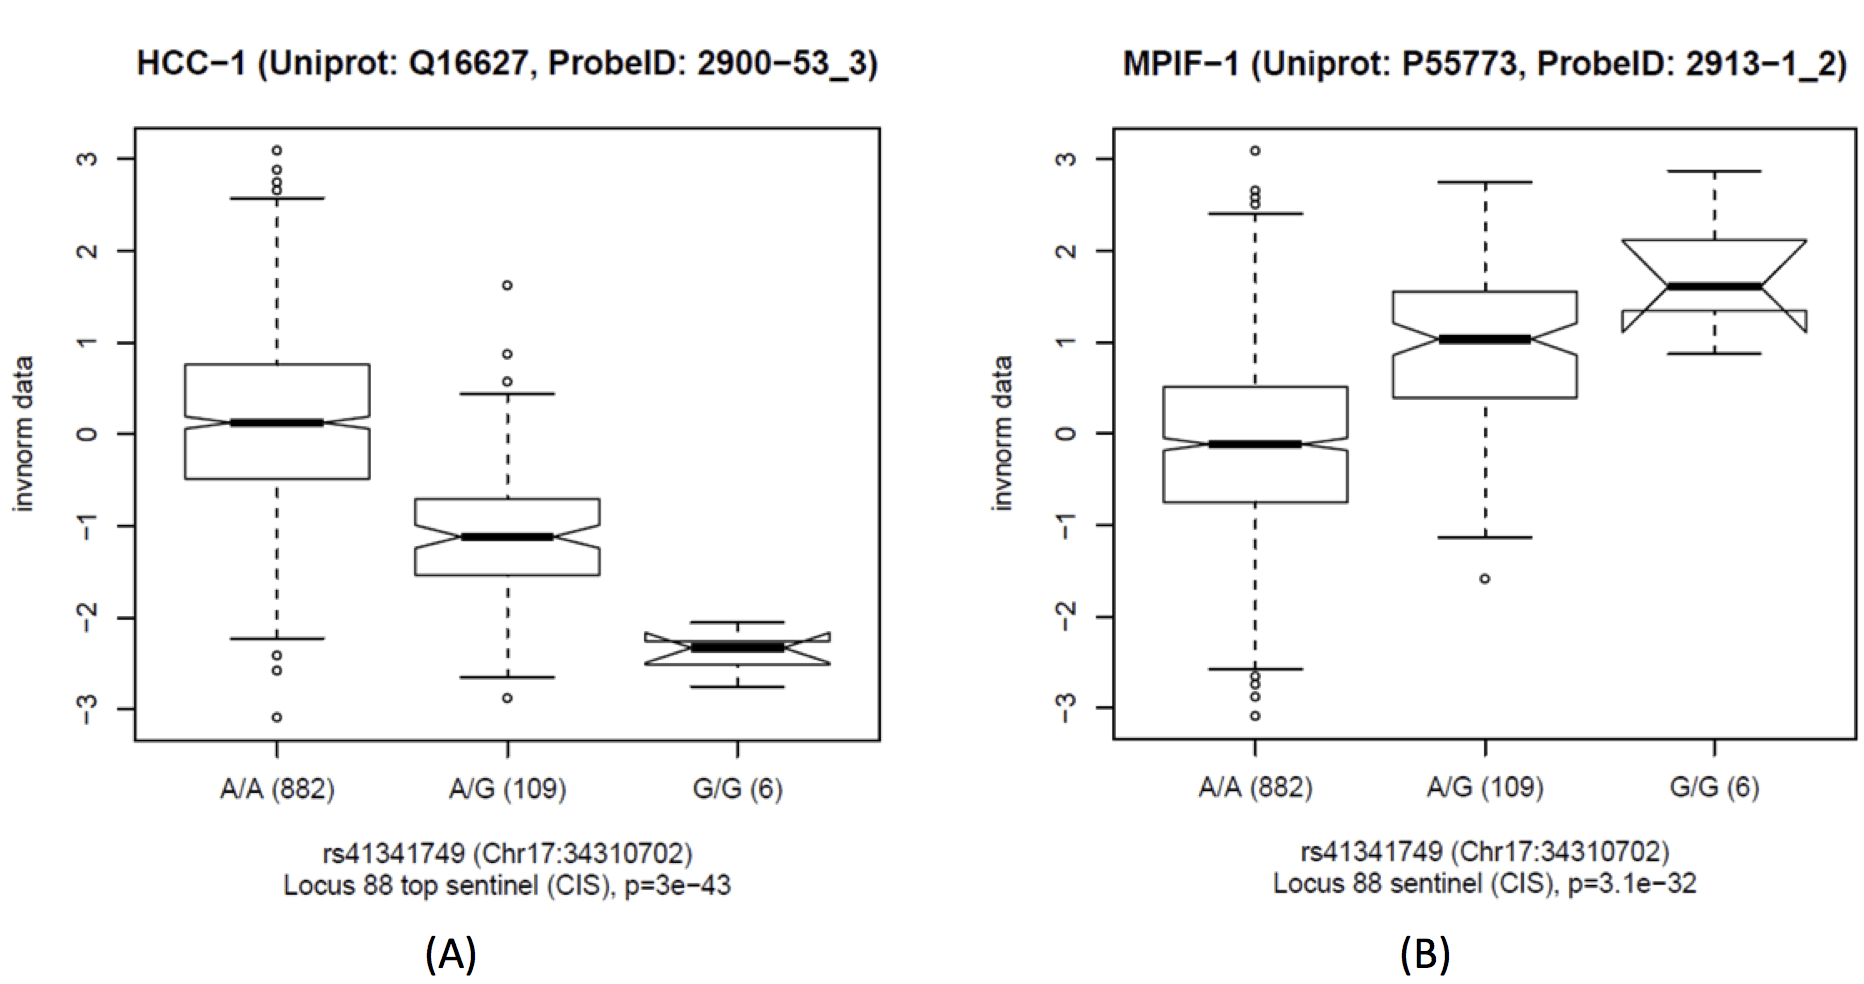
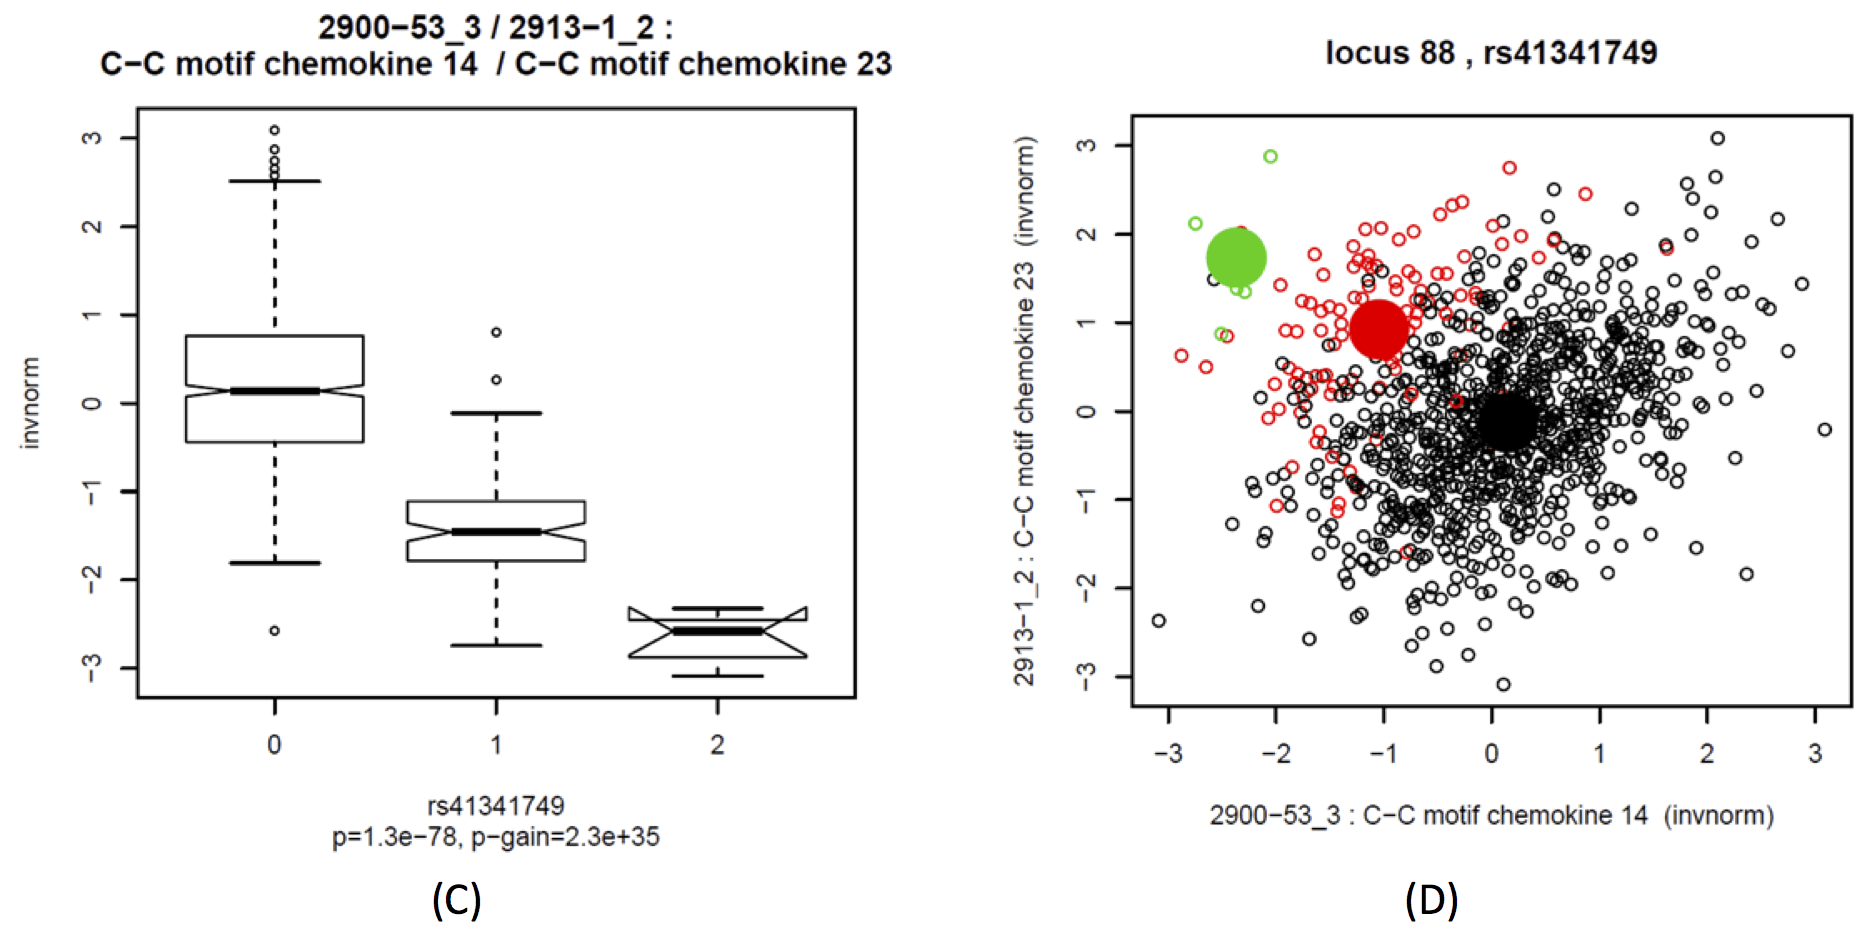
Boxplots of C-C motif chemokine 14 (CCL14, aka HCC-1) (A), C-C motif chemokine 23 (CCL23, aka MPIF-1) (B) and the ratio between both (C) as a function of rs41341749 (Locus 88); Scatterplot of CCL14 against CCL23, colored by genotype; black = major allele homozygotes, red = heterozygotes, green = minor allele homozygotes; means by genotype = large filled circles (D).
The information gathered here is a result of an attempt to keep track of all interesting information that we encountered while investigating these loci. Please bear in mind that the annotation given here is neither complete nor free of errors, and that all information provided here should be confirmed by additional literature research before being used as a basis for firm conclusions or further experiments.


